Somerville Housing Over Time |
September 5th, 2019 |
| housing, somerville |
| Decade | Number Built |
|---|---|
| 17xx | 7 |
| 180x | 36 |
| 182x | 3 |
| 183x | 1 |
| 184x | 30 |
| 185x | 65 |
| 186x | 79 |
| 187x | 143 |
| 188x | 476 |
| 189x | 1025 |
| 190x | 4657 |
| 191x | 1863 |
| 192x | 2104 |
| 193x | 401 |
| 194x | 55 |
| 195x | 75 |
| 196x | 104 |
| 197x | 181 |
| 198x | 394 |
| 199x | 72 |
| 200x | 24 |
| 201x | 51 (57 projected) |
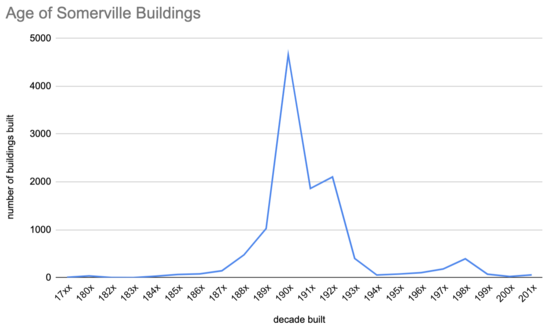
In estimating how much building was happening in various decades this will be biased towards the present: a building that was demolished and replaced will show up as being built recently, replacing the earlier older listing. On the other hand, newer projects are often larger, as former industrial sites are converted to housing. Still, it shows that current building levels in Somerville, while higher than in the 2000s, are still very low by historical standards.
(The most recent year I see in the data is 2018, so I've scaled the numbers for the 2010s decade up by 10/9 to reflect that we're missing 2019 data. I've also truncated the data to just the decade because my understanding is it's common for the database to use the first year as a stand in for "some time that decade", with 1910 to mean 1910s. Only 11,847 of the 12,145 parcel records contain a "Year Built" field so I'm ignoring the other 2%. I'm also ignoring 84 Perkins St, parcel 14057, which claims to have been built in 1518.)
Comment via: facebook, substack
