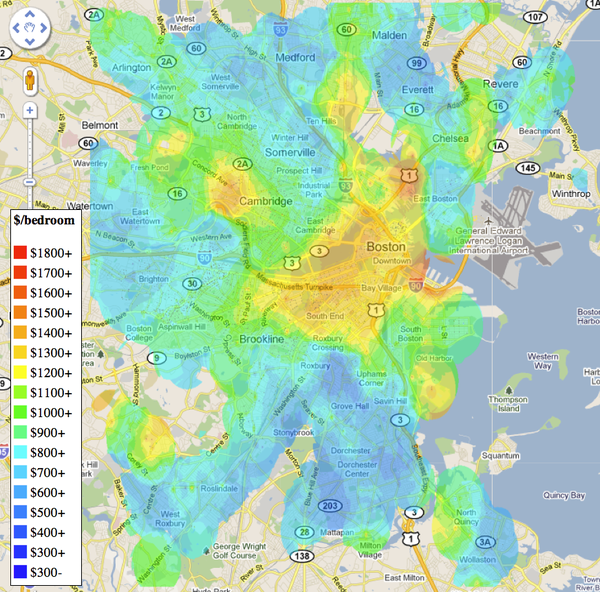
Boston Apartment Prices Map |
June 18th, 2011 |
| housing, map, tech |

(I also made a larger interactive
version)
The data comes from the excellent site padmapper that gets its listings from craigslist and elsewhere. The data points are black dots. The farther you are from dots and the less dense they are in an area, the less accurate it will be. The data is current; I'll probably do another one once all the 9/1 apartments are on the market.
The interpolation is inverse distance weighted averaging, where I'm lazy and am using simple cartesian distance on lat/lon instead of real great circle distance. Locations that don't have at least five data points within some threshold distance are left transparent.
Update 2011-10-07: Michael Bergman writes in:
Something outside your data that I noted a number of years ago when looking at both rentals and homes for sale is that in Cambridge, a placed listed as a 2-bedroom apartment had two bedrooms, a bath, and a kitchen; in Somerville it had two bedrooms, a living room, a bath, and a kitchen (and maybe some storage space in the basement); and in Arlington it had two bedrooms, a dining room, a living room, maybe an enclosed sun porch, a bath, a kitchen--and half a cellarThis suggests doing something by square foot would be good, though I don't think I can get that data as easily. So something to keep in mind: in the cheaper areas, landlords have likely made less of an attempt to convert any space that could possibly be a bedroom into one.
Update 2012-06-29: Someone suggested it made more sense to plot price per room instead of price per bedroom. Assuming that each apartment had one more room then bedroom I generated a new map.
Comment via: facebook, r/boston