Inline Plotting in iTerm2 |
September 14th, 2023 |
| cli, tech |
$ ./some-cmd.py plot.png && open plot.png
Which pops up a Preview window with my plot, and then I close it and go back to my coding. What I'd really like, though, is for this to be directly in my terminal. And this is possible!
The iTerm2 terminal supports an inline images
protocol, and itermplot provides
a matplotlib backend that speaks this protocol. Which means after
updating my .bashrc to have:
export MPLBACKEND="module://itermplot"
export ITERMPLOT="rv"
I can write:
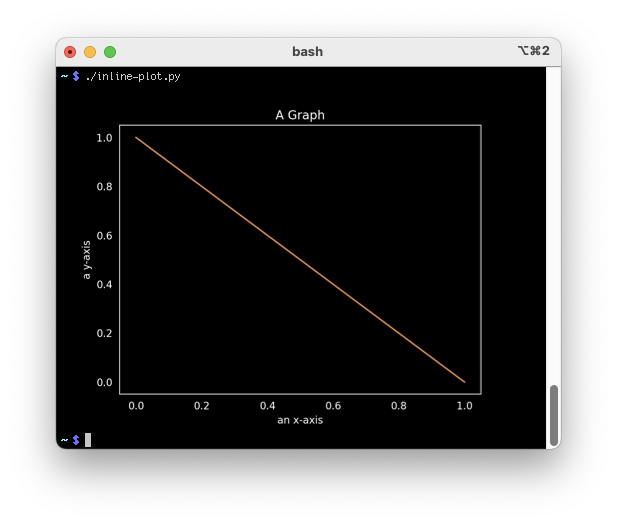
./inline-plot.py:
  #!/usr/bin/env python3
  import matplotlib.pyplot as plt
  fig, ax = plt.subplots()
  ax.plot([0,1], [1,0])
  plt.title("A Graph")
  plt.xlabel("an x-axis")
  plt.ylabel("a y-axis")
  plt.show()
And when I run it as ./inline-plot.py I see:
Of course I would normally have it alongside a lot of other terminals with related work:
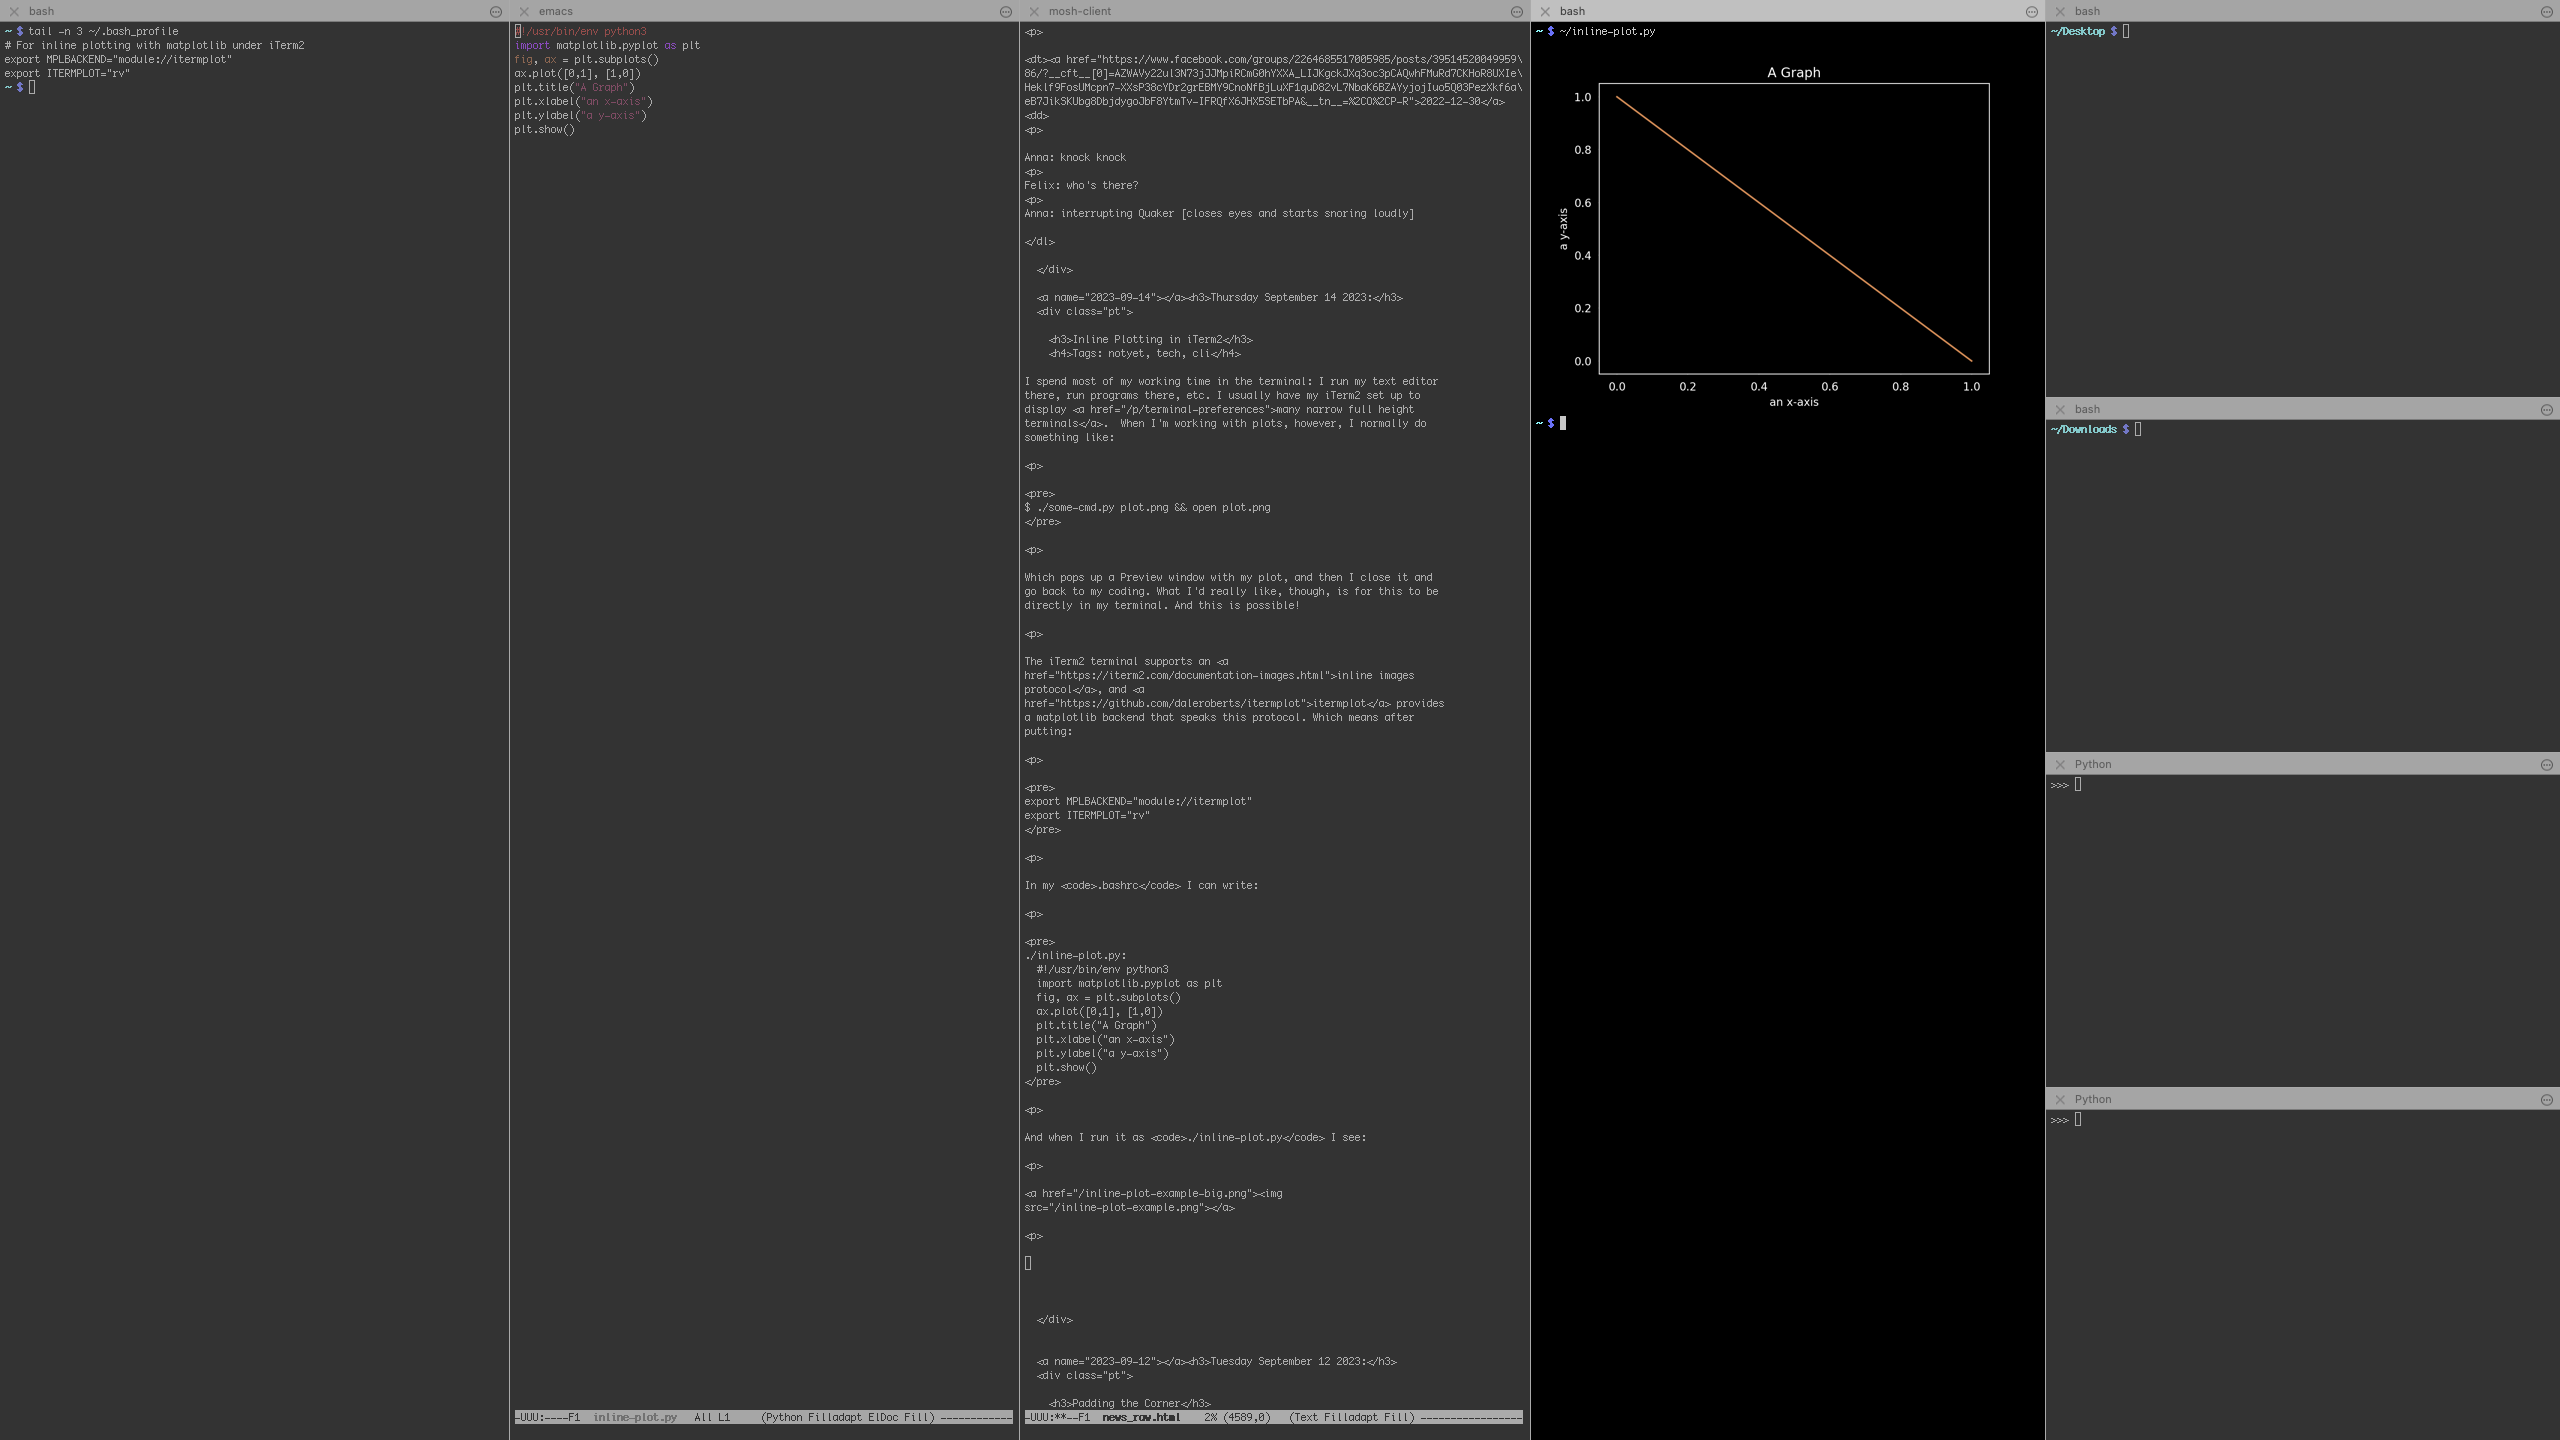
When showing complex charts I do notice it slows down that terminal a little, but it doesn't affect the other terminals and it's back to full speed when I clear it.
I've only just started using it, but I'm quite excited about it! It's a very good fit for my workflow.
Comment via: facebook, lesswrong, mastodon, substack